## [](http://knowm.org/open-source/xchart) XChart
XChart is a light weight Java library for plotting data.
## Description
XChart is a light-weight and convenient library for plotting data designed to go from data to chart in the least amount of time possible and to take the guess-work out of customizing the chart style.
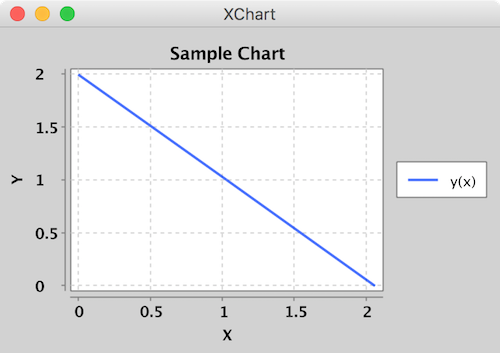
Usage is very simple: Create a `Chart` instance, add a series of data to it, and either save it or display it.
## Simplest Example
```java
double[] xData = new double[] { 0.0, 1.0, 2.0 };
double[] yData = new double[] { 2.0, 1.0, 0.0 };
// Create Chart
Chart chart = QuickChart.getChart("Sample Chart", "X", "Y", "y(x)", xData, yData);
// Show it
new SwingWrapper(chart).displayChart();
// Save it
BitmapEncoder.saveBitmap(chart, "./Sample_Chart", BitmapFormat.PNG);
// or save it in high-res
BitmapEncoder.saveBitmapWithDPI(chart, "./Sample_Chart_300_DPI", BitmapFormat.PNG, 300);
```

Charts can be saved as JPG, PNG, GIF, BMP, EPS, SVG, and PDF.
## Chart Customization
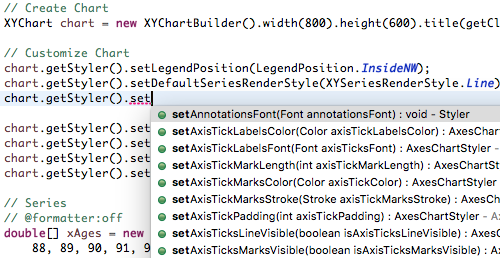
All the styling options can be found in one of two possible places: 1) the Chart's `StyleManager` or 2) the series' `set` methods. With this chart customization design, all customization options can be quickly "discovered" using an IDE's built in "Content Assist". With centralized styling like this, there is no need to hunt around the entire charting API to find that one customization you're looking for - it's all right in one spot!


## Chart Themes
XChart ships with three different themes: Default **XChart**, **GGPlot2** and **Matlab**. Using a different theme is as simple as setting the Chart's theme with the `theme` method of the `ChartBuilder`.
Chart chart = new ChartBuilder().width(800).height(600).theme(ChartTheme.Matlab).build();

## Features
* [x] No required additional dependencies
* [x] ~100KB Jar
* [x] Line charts
* [x] Scatter charts
* [x] Area charts
* [x] Bar charts
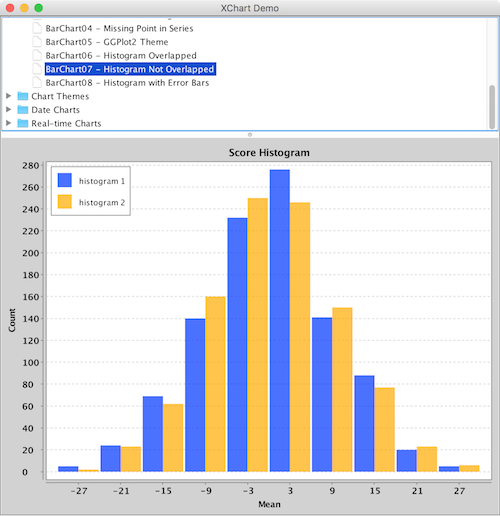
* [x] Histogram charts
* [x] Error bars
* [x] Logarithmic axes
* [x] Date and category X-Axis
* [x] Multiple series
* [x] Extensive customization
* [x] Themes - XChart, GGPlot2, Matlab
* [x] Right-click, Save-As...
* [x] User-defined axes range
* [x] Custom legend placement
* [x] CSV import and export
* [x] High resolution chart export
* [x] Export as PNG, JPG, BMP, GIF with custom DPI setting
* [x] Export SVG, EPS and PDF using optional de.erichseifert.vectorgraphics2d library
* [x] Real-time charts
* [x] Java 6 and up
## What's Next?
Now go ahead and [study some more examples](http://knowm.org/open-source/xchart/xchart-example-code/), [download the thing](http://knowm.org/open-source/xchart/xchart-change-log) and [provide feedback](https://github.com/timmolter/XChart/issues).
## Getting Started
### Non-Maven
Download Jar: http://knowm.org/open-source/xchart/xchart-change-log
### Maven
The XChart release artifacts are hosted on Maven Central.
Add the XChart library as a dependency to your pom.xml file:
```xml
<dependency>
<groupId>org.knowm.xchart</groupId>
<artifactId>xchart</artifactId>
<version>2.6.1</version>
</dependency>
```
For snapshots, add the following to your pom.xml file:
```xml
<repository>
<id>sonatype-oss-snapshot</id>
<snapshots/>
<url>https://oss.sonatype.org/content/repositories/snapshots</url>
</repository>
<dependency>
<groupId>org.knowm.xchart</groupId>
<artifactId>xchart</artifactId>
<version>3.0.0-SNAPSHOT</version>
</dependency>
```
Snapshots can be manually downloaded from Sonatyope: [https://oss.sonatype.org/content/groups/public/org/knowm/xchart/xchart/](https://oss.sonatype.org/content/groups/public/org/knowm/xchart/xchart/)
### SBT
To use XChart with the Scala Build Tool (SBT) add the following to your build.sbt
```scala
libraryDependencies += "org.knowm.xchart" % "xchart" % "2.6.0" exclude("de.erichseifert.vectorgraphics2d", "VectorGraphics2D") withSources()
```
(SBT/Ivy does not seem to respect the optional [VectorGraphics2D](https://github.com/eseifert/vectorgraphics2d) dependency and as it does not exist in Maven Central the build will fail unless it is excluded or available in a local repository.)
## Building
#### general
mvn clean package
mvn javadoc:aggregate
#### maven-license-plugin
mvn license:check
mvn license:format
mvn license:remove
## Running Demo
cd /path/to/xchart-demo/jar/
java -cp xchart-demo-2.6.1.jar:xchart-2.6.1.jar org.knowm.xchart.demo.XChartDemo

## Bugs
Please report any bugs or submit feature requests to [XChart's Github issue tracker](https://github.com/timmolter/XChart/issues).
## Continuous Integration
[](https://travis-ci.org/timmolter/XChart.png)
[Build History](https://travis-ci.org/timmolter/XChart/builds)
## Donations
Donate with Bitcoin: [1JVyTP9v9z54dALuhDTZDQfS6FUjcKjPgZ](https://blockchain.info/address/1JVyTP9v9z54dALuhDTZDQfS6FUjcKjPgZ)
All donations will be used to pay bounties for new features, refactoring, etc. Please consider donating or even posting your own bounties on our [Issues Page](https://github.com/timmolter/xchart/issues?state=open). Open bounties and bounties paid thus far can be found on knowm's [bounties](http://knowm.org/open-source/) page.
## Release Information
We will announce new releases on our [Twitter page](https://twitter.com/Knowmorg).