Newer
Older

## [](http://knowm.org/open-source/xchart) XChart

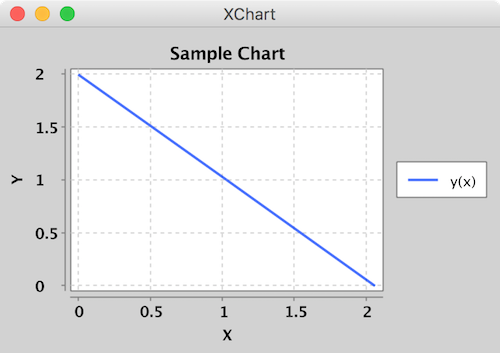
XChart is a light-weight and convenient library for plotting data designed to go from data to chart in the least amount of time possible and to take the guess-work out of customizing the chart style.
Create a `XYChart` instance via `QuickChart`, add a series of data to it, and either display it or save it as a bitmap.
    double[] xData = new double[] { 0.0, 1.0, 2.0 };
    double[] yData = new double[] { 2.0, 1.0, 0.0 };
XYChart chart = QuickChart.getChart("Sample Chart", "X", "Y", "y(x)", xData, yData);
    // Show it
    new SwingWrapper(chart).displayChart();

    // Save it
BitmapEncoder.saveBitmap(chart, "./Sample_Chart", BitmapFormat.PNG);
BitmapEncoder.saveBitmapWithDPI(chart, "./Sample_Chart_300_DPI", BitmapFormat.PNG, 300);
## Intermediate Example
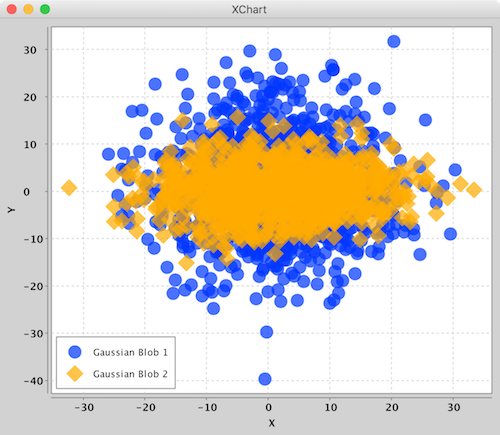
Create a `XYChart` via a `XYChartBuilder`, style chart, add a series to it, style series, and display chart.
```java

    // Create Chart
XYChart chart = new XYChartBuilder().width(600).height(500).title("Gaussian Blobs").xAxisTitle("X").yAxisTitle("Y").build();
    // Customize Chart
    chart.getStyler().setDefaultSeriesRenderStyle(ChartXYSeriesRenderStyle.Scatter);
    chart.getStyler().setChartTitleVisible(false);
    chart.getStyler().setLegendPosition(LegendPosition.InsideSW);
    chart.getStyler().setMarkerSize(16);

    // Series
    chart.addSeries("Gaussian Blob 1", getGaussian(1000, 1, 10), getGaussian(1000, 1, 10));
XYSeries series = chart.addSeries("Gaussian Blob 2", getGaussian(1000, 1, 10), getGaussian(1000, 0, 5));
series.setMarker(SeriesMarkers.DIAMOND);
new SwingWrapper(chart).displayChart();
```
## Advanced Example
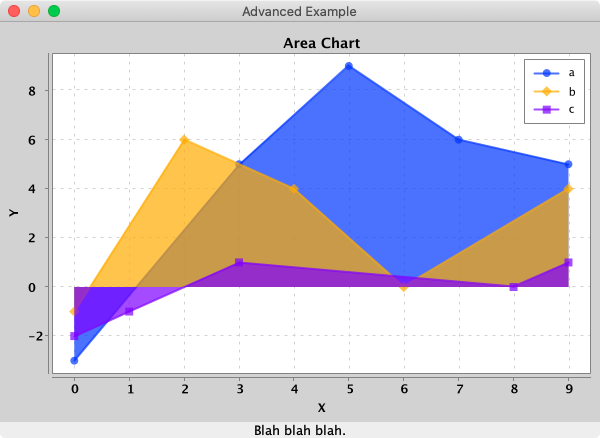
Create a `XYChart` via a `XYChartBuilder`, style chart, add a series to it, add chart to `XChartPanel`, embed in Java Swing App, and display GUI.
final XYChart chart = new XYChartBuilder().width(600).height(400).title("Area Chart").xAxisTitle("X").yAxisTitle("Y").build();
    // Customize Chart
    chart.getStyler().setLegendPosition(LegendPosition.InsideNE);
chart.getStyler().setDefaultSeriesRenderStyle(XYSeriesRenderStyle.Area);
    // Series
    chart.addSeries("a", new double[] { 0, 3, 5, 7, 9 }, new double[] { -3, 5, 9, 6, 5 });
    chart.addSeries("b", new double[] { 0, 2, 4, 6, 9 }, new double[] { -1, 6, 4, 0, 4 });
    chart.addSeries("c", new double[] { 0, 1, 3, 8, 9 }, new double[] { -2, -1, 1, 0, 1 });

    // Schedule a job for the event-dispatching thread:
    // creating and showing this application's GUI.
    javax.swing.SwingUtilities.invokeLater(new Runnable() {

      @Override
      public void run() {
        // Create and set up the window.
        JFrame frame = new JFrame("Advanced Example");
        frame.setLayout(new BorderLayout());
frame.setDefaultCloseOperation(JFrame.EXIT_ON_CLOSE);
        // chart
        JPanel chartPanel = new XChartPanel<XYChart>(chart);
        frame.add(chartPanel, BorderLayout.CENTER);
        // label
        JLabel label = new JLabel("Blah blah blah.", SwingConstants.CENTER);
        frame.add(label, BorderLayout.SOUTH);
        // Display the window.
        frame.pack();
        frame.setVisible(true);
      }
    });
```
To make it real-time, simply call `updateXYSeries` on the `XYChart` instance to update the series data, followed by `revalidate()` and `repaint()` on the `XChartPanel` instance to repaint.
* [x] Line charts
* [x] Scatter charts
* [x] Area charts
* [x] Bar charts
* [x] Histogram charts
* [x] Donut charts
* [x] Bubble charts
* [x] Number, Date, Bubble and Category X-Axis
* [x] Multiple series
* [x] Extensive customization
* [x] Right-click, Save-As...
* [x] User-defined axes range
* [x] Custom legend placement
* [x] CSV import and export
* [x] High resolution chart export
* [x] Export SVG, EPS and PDF using optional `de.erichseifert.vectorgraphics2d` library
Currently, there are three major chart types: `XYChart`, `CategoryChart` and `PieChart`. Each type has its corresponding `ChartBuilder`, `Styler` and `Series`.
| Chart Type | Builder | Styler | Series | Allowed X-Axis Data Types | Default Series Render Style |
|---|---|---|---|---|---|
| XYChart | XYChartBuilder | XYStyler | XYSeries | Number, Date | Line |
| CategoryChart | CategoryChartBuilder | CategoryStyler | CategorySeries | Number, Date, String | Bar |
| PieChart | PieChartBuilder | PieStyler | PieSeries | String | Pie |
| BubbleChart | BubbleChartBuilder | BubbleStyler | BubbleSeries | Number, Date | Round |
The different Stylers contain chart styling methods specific to the corresponding chart type as well as common styling methods common across all chart types.

`XYChart` charts take Date or Number data types for the X-Axis and Number data types for the Y-Axis. For both axes, the tick marks are auto generated to span the range and domain of the data in evenly-spaced intervals.
Series render styles include: `Line`, `Scatter` and `Area`.

`CategoryChart` charts take Date, Number or String data types for the X-Axis and Number data types for the Y-Axis. For the X-Axis, each category is given its own tick mark.
Series render styles include: `Bar`, `Line`, `Scatter`, `Area` and `Stick`.

`PieChart` charts take String data types for the pie slice name and Number data types for the pie slice value.
Series render styles include: `Pie` and `Donut`.

### BubbleChart
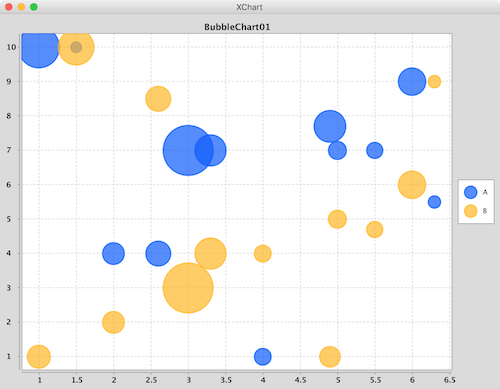
`BubbleChart` charts take Date or Number data types for the X-Axis and Number data types for the Y-Axis and bubble sizes.
Series render styles include: `Round` and in the near future `Square`.
185
186
187
188
189
190
191
192
193
194
195
196
197
198
199
200
201
202
203
204
205
206
207
208
209
210
211
212
213
214
215
216
217
218
219
220
221
222
223
224
225
226
227
228
229
230
231
232
233
234
235
236
237
238
Creating real-time charts is as simple as calling `updateXYSeries` for one or more series objects through the `XYChart` instance and triggering a redraw of the `JPanel` containing the chart. This works for all chart types including `XYChart`, `CategoryChart`, `BubbleChart` and `PieChart`, for which example source code can be found here: <https://github.com/timmolter/XChart/tree/develop/xchart-demo/src/main/java/org/knowm/xchart/demo/charts/realtime>. Examples demonstrate using the `SwingWrapper` with `repaintChart()` method as well as `XChartPanel` with `revalidate()` and `repaint()`.

The following sample code used to generate the above real-time chart can be found [here](https://github.com/timmolter/XChart/blob/develop/xchart-demo/src/main/java/org/knowm/xchart/standalone/SimpleRealTime.java).

```java
public class SimpleRealTime {

  public static void main(String[] args) throws Exception {

    double phase = 0;
    double[][] initdata = getSineData(phase);

    // Create Chart
    final XYChart chart = QuickChart.getChart("Simple XChart Real-time Demo", "Radians", "Sine", "sine", initdata[0], initdata[1]);

    // Show it
    final SwingWrapper<XYChart> sw = new SwingWrapper<XYChart>(chart);
    sw.displayChart();

    while (true) {

      phase += 2 * Math.PI * 2 / 20.0;

      Thread.sleep(100);

      final double[][] data = getSineData(phase);

      javax.swing.SwingUtilities.invokeLater(new Runnable() {

        @Override
        public void run() {

          chart.updateXYSeries("sine", data[0], data[1], null);
          sw.repaintChart();
        }
      });
    }

  }

  private static double[][] getSineData(double phase) {

    double[] xData = new double[100];
    double[] yData = new double[100];
    for (int i = 0; i < xData.length; i++) {
      double radians = phase + (2 * Math.PI / xData.length * i);
      xData[i] = radians;
      yData[i] = Math.sin(radians);
    }
    return new double[][] { xData, yData };
  }
}
```
## Chart Customization
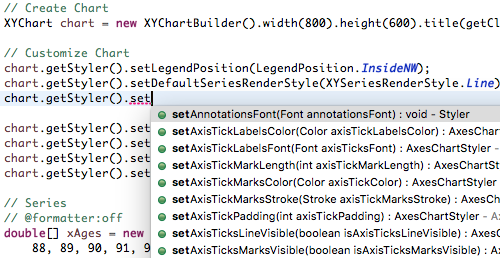
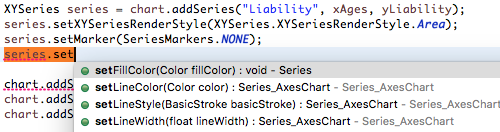
All the styling options can be found in one of two possible places: 1) the Chart's `Styler` or 2) the series' `set` methods. With this chart customization design, all customization options can be quickly "discovered" using an IDE's built in "Content Assist". With centralized styling like this, there is no need to hunt around the entire charting API to find that one customization you're looking for - it's all right in one spot!
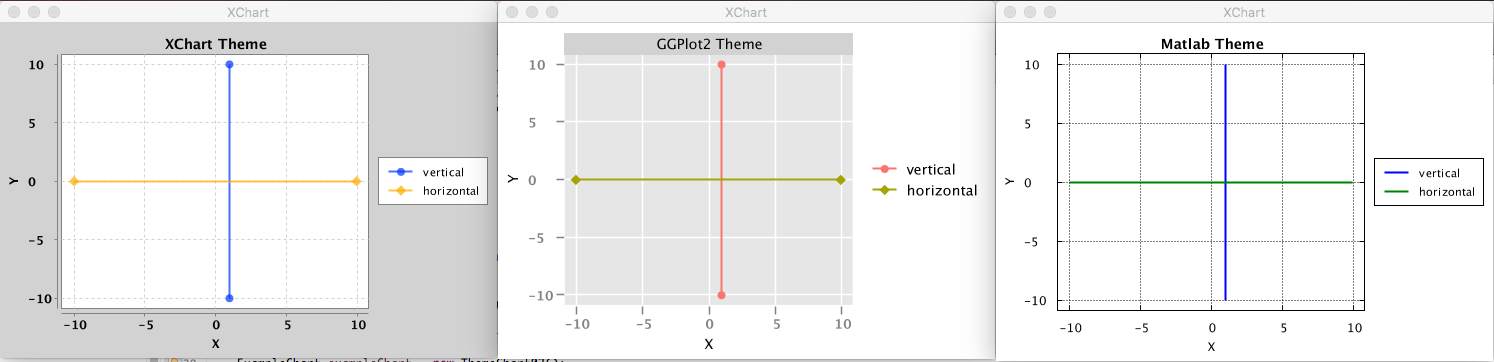
## Chart Themes
XChart ships with three different themes: Default `XChart`, `GGPlot2` and `Matlab`. Using a different theme is as simple as setting the Chart's theme with the `theme` method of the `ChartBuilder`.
XYChart chart = new XYChartBuilder().width(800).height(600).theme(ChartTheme.Matlab).build();
## What's Next?

Now go ahead and [study some more examples](http://knowm.org/open-source/xchart/xchart-example-code/), [download the thing](http://knowm.org/open-source/xchart/xchart-change-log) and [provide feedback](https://github.com/timmolter/XChart/issues).
Download Jar: http://knowm.org/open-source/xchart/xchart-change-log
Add the XChart library as a dependency to your pom.xml file:
      <snapshots/>
      <url>https://oss.sonatype.org/content/repositories/snapshots</url>
    </repository>
<version>3.2.1-SNAPSHOT</version>
Snapshots can be manually downloaded from Sonatyope: [https://oss.sonatype.org/content/groups/public/org/knowm/xchart/xchart/](https://oss.sonatype.org/content/groups/public/org/knowm/xchart/xchart/)

Christoffer SOOP
committed
### SBT

To use XChart with the Scala Build Tool (SBT) add the following to your build.sbt

```scala
libraryDependencies += "org.knowm.xchart" % "xchart" % "3.2.0" exclude("de.erichseifert.vectorgraphics2d", "VectorGraphics2D") withSources()
Christoffer SOOP
committed
```
#### general

    mvn clean package
#### maven-license-plugin

    mvn license:check
    mvn license:format
    mvn license:remove
java -cp xchart-demo-3.2.0.jar:xchart-3.2.0.jar org.knowm.xchart.demo.XChartDemo
Please report any bugs or submit feature requests to [XChart's Github issue tracker](https://github.com/timmolter/XChart/issues).
[](https://travis-ci.org/timmolter/XChart.png)
[Build History](https://travis-ci.org/timmolter/XChart/builds)
Donate with Bitcoin: [1JVyTP9v9z54dALuhDTZDQfS6FUjcKjPgZ](https://blockchain.info/address/1JVyTP9v9z54dALuhDTZDQfS6FUjcKjPgZ)
All donations will be used to pay bounties for new features, refactoring, etc. Please consider donating or even posting your own bounties on our [Issues Page](https://github.com/timmolter/xchart/issues?state=open). Open bounties and bounties paid thus far can be found on Knowm's [bounties](http://knowm.org/open-source/) page.
We will announce new releases on our [Twitter page](https://twitter.com/Knowmorg).